Step 6: How to Get a Data Packet
Click here to watch more SitePulse How-To videos on Youtube.
-
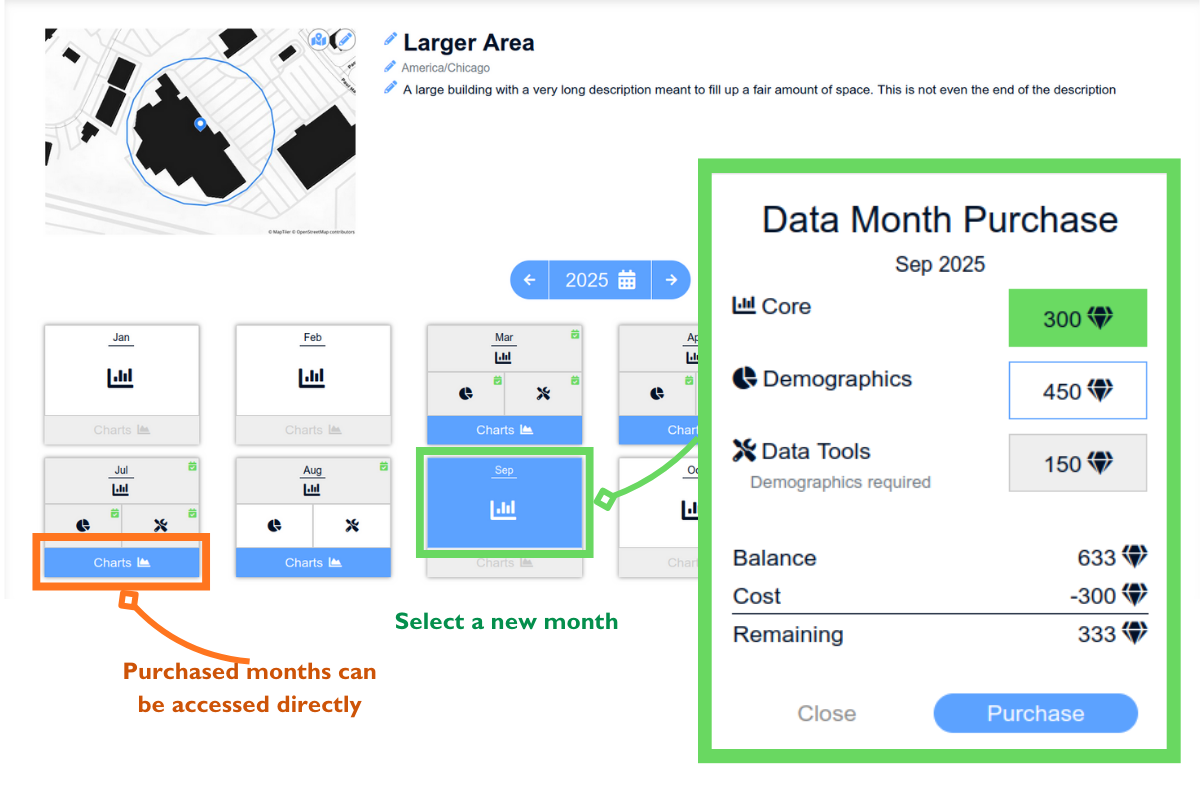
Open an approved location's detailed page to view available insights. To purchase data for a historical or new month, click on the calendar month and bring up the purchasing page. Select the data packet tier you want and click the “Purchase” button. The newly purchased product will display a yellow hourglass icon on the top right corner, indicating that SitePulse is generating the analytics. For insights you have purchased in the past, simply click the “Charts” button to access the analytics.
-
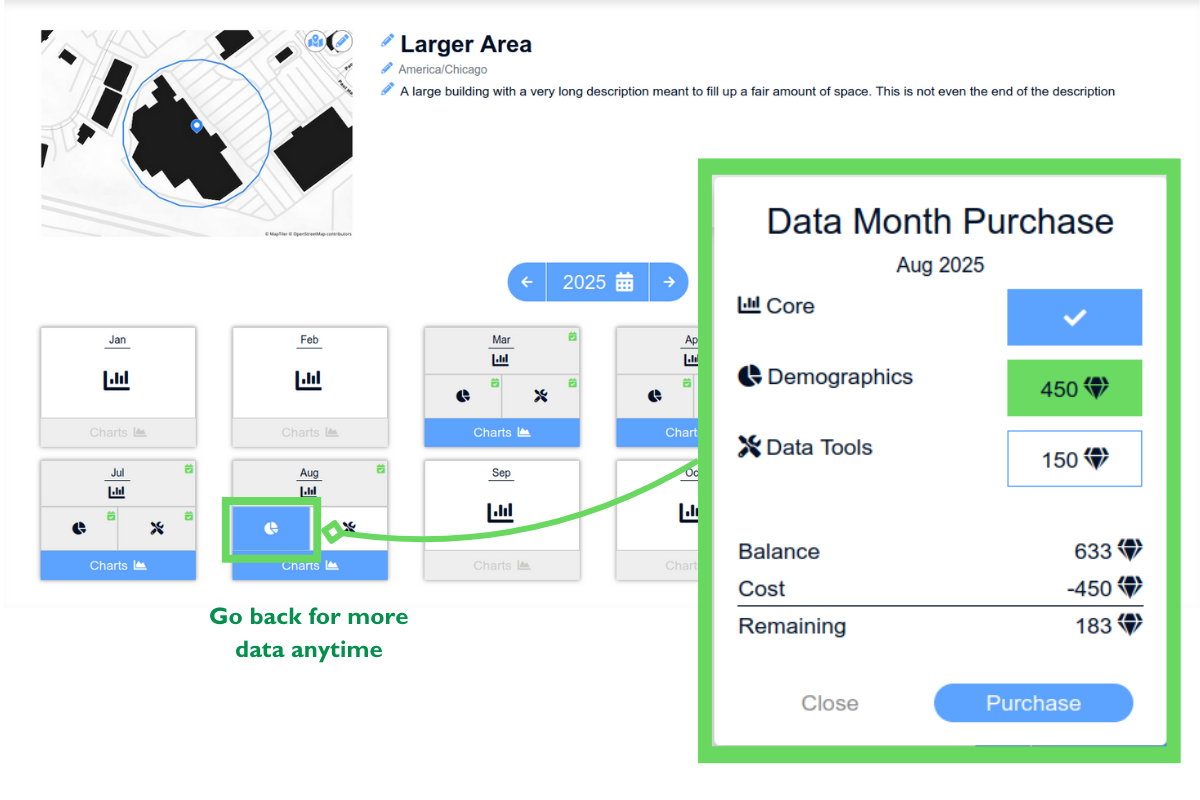
To purchase additional products for a month, click on the item you want to open the purchasing page. You can return at any time to purchase demographics and advanced tools for any historical month.
-
While SitePulse is generating analytics, the yellow hourglass icon appears in the top-right corner. Clicking the “Charts” button allows you to view progress through partially populated charts. Once processing is complete, the yellow hourglass icon changes to a green clipboard icon. You can also quickly access recently completed insights from the dashboard.
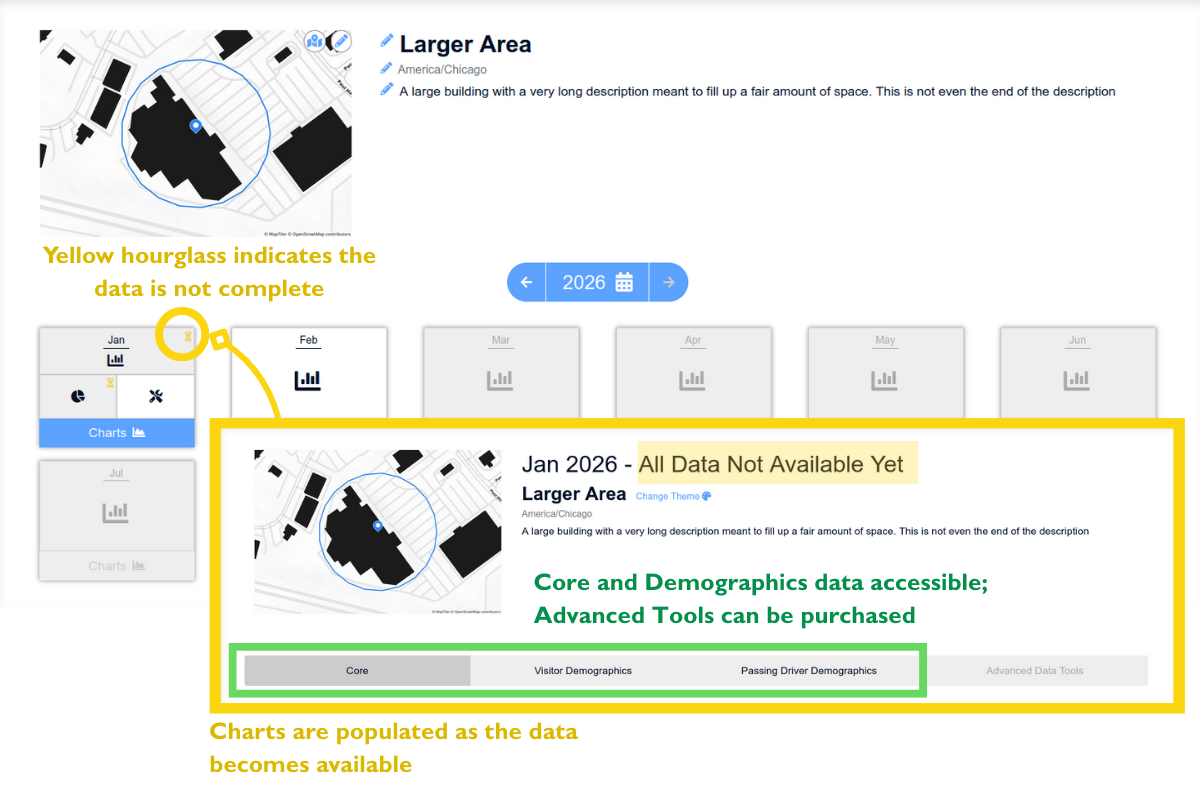
- Complete monthly data is typically available by the 9th of the following month. If you purchase before that date, you’ll get access to available days as they’re released. For example, if you buy February data on February 19th, you’ll immediately receive data from February 1st through the 10th, with the remaining days added as they become available.